Materials and Methods: A retrospective single-center study of 102 patients with histologically confirmed MTC (2020–2024) was conducted. Ki-67 was determined automatically using the nuclei instance segmentation pipeline (Cellpose-SAM, InstanSeg) with postprocessing in QuPath. Patients were stratified into groups with Ki-67<5% and Ki-67≥5%; the parameters were then compared using the Mann-Whitney U test and Fisher’s exact test with Bonferroni correction.
Results: Of 102 patients, 12 (11.8%) had Ki-67≥5%. In this group, male gender (58.3% vs. 23.3%; p=0.017), higher body mass index (p=0.005), as well as lymphatic (66.7% vs. 21.3%; p=0.002), vascular (58.3% vs. 15.9%; p=0.003), and perineural (25.0% vs. 2.3%; p=0.012) invasion were more frequent. After Bonferroni correction, intergroup differences in lymphatic and vascular invasion remained statistically significant. The InstanSeg model achieved an F1-score of 0.774.
Conclusion: An increase in Ki-67 ≥5% in MTC is associated with an aggressive invasive phenotype. Digital image analysis provides a reproducible assessment of Ki-67 and is promising for standardization of diagnostics.
Introduction
Medullary thyroid carcinoma (MTC) is a neuroendocrine tumor originating from the parafollicular C cells of the thyroid. It is characterized by clear clinical and morphological heterogeneity; it accounts for 1–5% of all malignant thyroid neoplasms [1, 2]. Despite its relatively low prevalence, MTC exhibits a variable clinical course ranging from indolent forms to aggressive variants with early lymphatic and hematogenous metastasis [3]. Currently, surgery is the primary treatment modality. However, the prognosis varies even among patients with the same tumor, node, metastasis (TNM) stage, thereby highlighting the need to identify additional morphological and molecular markers for risk stratification [4].
Lately, considerable attention has been focused on assessing tumor proliferative activity, the recommended marker for which is Ki-67 – a nuclear protein expressed during active phases of the cell cycle [5]. According to the International Medullary Thyroid Carcinoma Grading System (IMTCGS), a Ki-67 index ≥5%, the presence of tumor necrosis, and a mitotic index ≥5 mitoses per 2 mm² are criteria for high-grade MTC; and it is noteworthy that the presence of any single criterion is sufficient to establish this grade [6]. In their seminal study, B. Xu et al. identified a subset of high-grade MTC (approximately 24.8%) in the cohort under study, and its presence correlated with reduced overall survival, disease-specific survival, distant metastasis-free survival, and locoregional recurrence-free survival [6]. Similar results were obtained during independent re-evaluation by other authors [7, 8], confirming the prognostic validity of the proposed system. While the Ki-67 index was the most frequently reported staging parameter across these studies, none of them evaluated this parameter in isolation as a predictor of an adverse clinical course.
It has been demonstrated that an elevated values of Ki-67 index are associated with reduced overall and recurrence-free survival, the development of distant metastases, and a more aggressive disease course [6, 7]. However, the assessment of Ki-67 in MTC remains inconsistent in terms of methodology used. The use of diverse counting approaches, and variability in immunohistochemical (IHC) protocols and interpretation significantly limit the reproducibility of results and their comparability across studies. Despite the fact that inter-observer agreement regarding Ki-67 assessment within the IMTCGS framework was high [9], the highest discrepancies predictably arose near the 5% threshold value.
A study by S. Nadeem et al. evaluated and compared various methods for calculating the Ki-67 index [10]. Taking into account the variability of results across different techniques and time-consuming manual counting even in case of experienced specialists, the authors sought a faster yet equally accurate alternative, including the use of computer-assisted tools, such as DeepLIIF and Leica Aperio Nuclear. While these auxiliary methods demonstrated near-perfect correlation with manual counting, challenges arose in cases where Ki-67 levels fell within the 3–7% range. Hence, the researchers concluded that manual counting is mandatory in ambiguous cases [10]. Furthermore, they discovered that higher index values were associated with a poorer prognosis regardless of the analysis method, whereas no correlation was observed for Ki-67 proliferation levels with somatic or germline mutations in the RET (REarranged during Transfection) and RAS (Retrovirus-Associated DNA Sequences) genes [10].
In this context, digital pathology and automated image analysis is of particular interest. The use of instance segmentation algorithms and deep learning models allows enhancing objectivity and standardizing the quantitative assessment of Ki-67 in MTC [11]. However, the number of studies dedicated to the automated analysis of the Ki-67 index specifically for this tumor type remains limited.
The growing popularity of machine learning in patient diagnosis and management stems from its ability to significantly streamline routine tasks in modern clinical practice. For instance, in a study by A. Dy et al., a tool for assessing Ki-67 proliferative activity in breast cancer was utilized: The same specialists analyzed cases with and without the built-in assistant, and the accuracy of determining the Ki-67 index was significantly higher when using such assistants [12]. Although this approach cannot be directly applied to MTC, it highlights the value of further research into automating Ki-67 calculation. QuPath, an open-source software platform for quantitative digital image analysis, is not a neural network; however, various deep learning models can be integrated into it. The advantages of this approach over a number of alternative solutions have been confirmed by independent studies. Comparisons of several digital image analysis platforms, including QuPath, have demonstrated high inter-platform and inter-operator reproducibility in the quantitative assessment of Ki-67 (with an intraclass correlation coefficient of up to 0.97) [13]. A separate study focusing specifically on neuroendocrine tumors proposed and clinically validated optimal settings for automated Ki-67 counting using QuPath, confirming the platform’s applicability to tumors of this histogenesis [14]. Furthermore, a systematic review and meta-analysis of neuroendocrine neoplasms demonstrated that digital methods for Ki-67 counting generally provide superior standardization and reproducibility, compared with manual counting [15]. Collectively, these data, along with the platform’s open-source nature, widespread adoption within the pathomorphological community, and the ability to flexibly integrate third-party TorchScript segmentation models (including InstanSeg), justify the selection of QuPath as the post-processing software environment for our study.
We would like to point out that no automated counting method can replace assessment by a specialist physician; rather, such methods serve just as an aid to improve accuracy and accelerate the analysis [12].
Objective: To evaluate the clinical and morphological significance of the Ki-67 index in medullary thyroid carcinoma using automated digital analysis of IHC images.
Materials and methods
Study design
We conducted a retrospective single-center clinical and morphological study of patients with MTC, followed by digital analysis of Ki-67 expression by IHC method. Groups were formed based on the level of tumor proliferative activity (Ki-67<5% and Ki-67≥5%).
Study location and time
The study was conducted at the I.I. Dedov National Medical Research Center for Endocrinology of the Russian Federation Ministry of Healthcare (DNMRCE). Patient inclusion period: 2020 to 2024.
Study population and selection criteria
One population was studied: patients with histologically confirmed MTC. The sample was formed by continuously including observations that met the selection criteria.
Inclusion criteria:
- Histologically confirmed MTC;
- Availability of archived surgical material;
- Available clinical and morphological data;
- Availability of Ki-67 IHC study and subsequent digital image analysis.
Exclusion criteria:
- Insufficient quality of histological preparations;
- Significant staining artifacts;
- Tumor tissue volume for analysis.
Methodology
Immunohistochemistry. IHC study was performed on the Leica BOND-III Fully Automated IHC and In Situ Hybridization Staining System (Leica Biosystems Melbourne Pty Ltd., Australia) in accordance with the manufacturer’s recommended standard protocols. Monoclonal antibodies to Ki-67 (clone MIB-1, 1:150 dilution; Dako, Denmark) were utilized for IHC analysis. All results were initially assessed using a Leica DM4000 microscope (Leica Microsystems, Germany) in manual mode. The Ki-67 proliferative activity index was calculated at regions of interest (ROIs). Digital images of selected areas of the specimens were then produced using a Leica DFC490 camera at ×200 and ×400. For specimens photographed at ×200, the image size was 3,264×2,448 pixels.
Digital analysis platform. The experiments were conducted on a Windows workstation (13th or 14th generation Intel Core i7/i9, ~4.45–5.25 GHz). The development environment was Anaconda (conda), using Python. The main libraries were Cellpose-SAM (mask preparation) [16], InstanSeg (final instance segmentation) [17], and QuPath (postprocessing and measurements, Groovy/Java scripts) [18].
Dataset formation. We used digital slides of sections stained with antibodies to Ki-67, scanned at a magnification of 200. The dataset consisted of 73 images at a magnification of 200. Patches measuring 512×512 pixels were extracted from each image; the final training set contained 2,555 image–mask pairs. A separate model was not trained for ×400. Instead, a model was used at ×200 with downsampling in the QuPath environment, which ensured acceptable segmentation quality. A patch size of 512×512 pixels was chosen as a compromise between the amount of contextual information and the stability of training; the pixel size was set to 0.25 μm/px, which corresponds to the optical calibration of the scanner at ×200.
Iterative mask annotation (Cellpose-SAM). Nuclear mask annotation was performed in several iterations to maximize coverage of the variability of the preparations:
(1) Initialization: running Cellpose-SAM on original images to obtain primary nuclear masks;
(2) Training the baseline model: the first Cellpose model was trained on 73 centrally cropped patches of 256×256 pixels (100 epochs);
(3) Application and correction: the model was applied to all images in their entirety, with segmentation artifacts manually removed;
(4) Iterative retraining: masks were updated on the full images, and the model was retrained with incremental inclusion of the corrected data until acceptable quality was achieved; the final Cellpose model was trained for 250 epochs.
Training the InstanSeg model. InstanSeg is an open-source, embedding-based instance segmentation pipeline that provides high accuracy and efficiency (reducing processing time by at least 60% vs. similar algorithms) and is fully portable via TorchScript serialization [17]. Aggressive augmentation (reflections, rotations, brightness and contrast variations, elastic deformations) was employed to compensate for the limited volume of annotated data. The key training hyperparameters are presented in Table 1.
Table 1. Key hyperparameters for training the InstanSeg model
| Parameter | Value | Description |
|---|---|---|
| Number of epochs | 350 | Ensures convergence with the given dataset size |
| Batch size | 4 | VRAM usage limits; stable gradient |
| Augmentation type | heavy | Compensation for small dataset size |
| Tile size | 512 × 512 px | Standard for histological patches |
| Pixel size | 0.25 µm/px | Calibration for 200× magnification |
| Target | N (nuclei) | Nuclei segmentation |
VRAM, video random access memory; px, pixel; N (nuclei), nucleus segmentation mode.
Quality metrics and postprocessing in QuPath. The primary metric was the F1-score (the harmonic mean of precision and recall) for the instance segmentation task, calculated on a test set (15% of the dataset) after each epoch; this metric is standard for assessing cell detection and segmentation in digital pathology. Train loss and test loss were tracked as well. Of the 2,555 image-mask pairs, 383 pairs were designated as the test set (15%), and the remaining 85% (≈2,172 pairs) as the training set. The split into training and test subsets was performed at the level of the original image: all patches related to a single original image were entirely assigned to either the training subset or test subset, eliminating any overlap between them.
After exporting the final InstanSeg model, the latter was integrated with QuPath via the appropriate extension [18]. Separate scripts for ×200 and ×400 slides were developed in the QuPath environment. These scripts initiate segmentation on full images, measure morphometric parameters of nuclei (area, perimeter, and DAB staining intensity), perform binary classification of nuclei into Ki-67-positive and Ki-67-negative, and export measurement results in tabular format.
Group analysis
Patients were divided into two groups based on the level of the nuclear protein under study: Ki-67<5% and Ki-67≥5%. The 5% threshold was chosen in accordance with the IMTCGS, where Ki-67≥5% is considered one of the criteria for high-grade MTC [6].
Statistical analysis
Statistical analysis was conducted using the R programming language, version 4.2.2 (R Foundation for Statistical Computing, Austria) and the Statistica 12 package (TIBCO Software Inc., USA). Descriptive statistics for quantitative data are presented as median and interquartile range (Me [Q1; Q3]), while qualitative data are presented as counts and relative frequencies (%). Comparisons of two independent groups for quantitative data were performed using the Mann–Whitney U test; while for categorical characteristics, using the two-tailed Fisher’s exact test and the Freeman–Halton extension of Fisher’s exact test. The critical level of statistical significance was set at 0.05. For multiple comparisons, the Bonferroni correction was applied by adjusting the critical level of significance. P-values are presented to the third decimal place.
Statistical comparisons were performed only between the clinical and morphological groups, Ki-67<5% and Ki-67≥5% (Table 2). No comparison was made between patients with a histologically confirmed diagnosis and those without confirmation, as histological verification of MTC was a mandatory inclusion criterion for all patients (102) in the study.
Table 2. Clinical and morphological characteristics of patients with medullary thyroid carcinoma (MTC) based on Ki-67 index value
| Parameter, count (%) * | Ki-67 | p | |
|---|---|---|---|
| ≥5% (n=12) | <5% (n=90) | ||
| Male gender | 7 (58.3) | 21 (23.3) | 0.017 |
| BMI, kg/m2 | 33.4 [29.9; 35.5] | 26.75 [23.2; 31.5] | 0.005 |
| Stage T3a–T4 of MTC | 3 (25.0) | 4 (4.4) | – |
| N1b | 5 (41.7) | 12 (13.5) | – |
| Lymphatic invasion (L1) | 8 (66.7) | 19 (21.3) | 0.002 |
| Vascular invasion (V1) | 7 (58.3) | 14 (15.9) | 0.003 |
| Perineural invasion (Pn1) | 3 (25.0) | 2 (2.3) | 0.012 |
*Except for BMI, data are presented as Me [Q1; Q3]; qualitative and quantitative variables were compared using Fisher’s exact test (two-sided) and Mann-Whitney U test, respectively; after Bonferroni correction, differences regarding lymphatic and vascular invasion remained statistically significant; en dash indicates the difference is not statistically significant; L1, lymphatic invasion; V1, vascular invasion; Pn1, perineural invasion.
Ethical review
The study protocol was approved by the Ethics Committee of DNMRCE (Protocol No. 1 of January 15, 2025).
Results
Sample characteristics
The study included 102 patients with MTC, including 28 (27.5%) men and 74 (72.5%) women. Their median age was 54 years [41; 65] and median body mass index (BMI) was 27.75 kg/m2 [23.35; 32.0]. Ultrasound imaging data suggested that the most frequently identified tumor category was 5 (high risk of malignancy) on EU-TIRADS (European Thyroid Imaging Reporting and Data System) scale (67 [69.1%]) patients; the median maximum tumor node size was 12 mm [9; 19]. According to the Bethesda cytological classification, the most prevalent categories were Bethesda V (49 [52.7%]) and Bethesda VI (34 [36.6%]).
The distribution of patients according to the TNM classification (8th edition) was represented mostly by early tumor stages: T1a (46 [45.1%]), T1b (36 [35.3%]), T2 (13 [12.7%]), T3a (5 [4.9%]), T3b (1 [1.0%]), T4 (1 [1.0%]). Metastatic involvement of regional lymph nodes (N1a/N1b) was observed in 31 (30.7%) patients. Lymphatic invasion (L1), vascular invasion (V1) and perineural invasion (Pn1) were diagnosed in 27 (26.7%), 21 (21.0%), and 5 (5.1%) patients, respectively. The median Ki-67 index in the total sample was 1.35% [0.63; 2.2].
Clinical and morphological parameters depending on the Ki-67 level
To assess the clinical and morphological significance of the Ki-67 index, patients were divided into two groups: Ki-67≥5% (n=12) and Ki-67<5% (n=90). The median Ki-67 was 7.4% [5.8; 12.1] in the ≥5% group and 1.05% [0.6; 1.8] in the <5% group. The results of the comparative analysis are presented in Table 2.
Patients with Ki-67≥5% were more often male: 58.3% vs. 23.3% in the Ki-67<5% group (p=0.017). The median BMI in the Ki-67≥5% group was higher: 33.4 kg/m2 [29.9; 35.5] vs. 26.75 kg/m2 [23.2; 31.5] (p=0.005). Analyzing the prevalence of the tumor process, we noted a trend toward a higher frequency of locally advanced cancer forms: stages T3a–T4 were determined in 25.0% of patients in the Ki-67≥5% group vs. 4.4% in the Ki-67<5% group. Metastatic involvement of the lymph nodes of the N1b category was also more common with Ki-67≥5%: in 41.7% vs. 13.5%.
The most distinct differences were revealed in the course of assessing the signs of invasive tumor growth. Lymphatic invasion (L1) was identified in 66.7% of patients with Ki-67≥5% and only in 21.3% of patients with Ki-67<5% (p=0.002). Vascular invasion (V1) was detected in 58.3% vs. 15.9% (p=0.003), and perineural invasion (Pn1) was observed in 25.0% vs. 2.3% (p=0.012). After Bonferroni correction, differences in lymphatic invasion and vascular invasion remained statistically significant, thereby suggesting an association between increased tumor proliferative activity and signs of an aggressive invasive phenotype.
This group of patients was followed for a period of 1 to 180 months with assessment of blood calcitonin levels. Calcitonin levels ≥10 pg/mL were detected in 5 patients (62%) with Ki-67 ≥5% vs. 10 patients (15%) with Ki-67 <5% (p=0.007). Despite this p-value, a trend toward differences between groups was observed, indicating a lack of biochemical remission in patients with higher levels of tumor proliferative activity.
Digital image analysis results: Training dynamics
We trained InstanSeg model on over 350 epochs, and the loss function steadily decreased throughout the training process. The best F1-score on the test set reached 0.774 at epoch 300, with the minimum test loss recorded at the same point. The initial train loss was 5.34, and its final value was 0.55 (which ascertained a 9.8-fold decrease).
Convergence and stability
In the range of 15-50 epochs, a rapid decrease in loss and a simultaneous increase in the F1-score from 0.487 to ~0.73 were observed. After epoch 50, both loss curves acquired a consistently flat profile with moderate fluctuations, characteristic of procedures with aggressive augmentation and small batch sizes. Over the final 50 epochs (300–350), the mean F1-score was 0.766±0.004, indicating that a plateau had been reached and there was no significant overfitting. The convergence of the train loss and test loss curves confirms the model’s satisfactory generalization capability on unseen data.
Segmentation quality and visualization
The achieved maximum value of F1-score (0.774) corresponds to a level typical of specialized instance segmentation models in histology trained on limited datasets with aggressive augmentation. Qualitative analysis of the output masks confirms progressive improvement of segmentation: at epoch 0, coarse, fuzzy edges with numerous false positives were observed; whereas by epochs 299–300, the edges of the nuclei became clear, overlapping objects were delineated, and false positives were minimized. InstanSeg, unlike sliding window models, delineates overlapping nuclei using embedding space, which is particularly relevant for highly proliferating tumors with densely packed cells.
Integration into the QuPath workflow
The final model was exported in the InstanSeg format for QuPath. Groovy scripts provide the batch processing of scans at ×200 and ×400, the automated extraction of morphometric and colorimetric features of nuclei, and the calculation of the Ki-67 index at both the ROI and full field-of-view (FFOV) levels. Examples of nuclear segmentation and measurement results at ×200 magnification are shown in Figures 1 and 2, while those at ×400 magnification are presented in Figures 3 and 4. Applying the model to specimens at ×400 without additional training (i.e., via downsampling within QuPath) demonstrates acceptable accuracy, thereby confirming satisfactory generalization capability of the trained model. Key experimental parameters are summarized in Table 3.
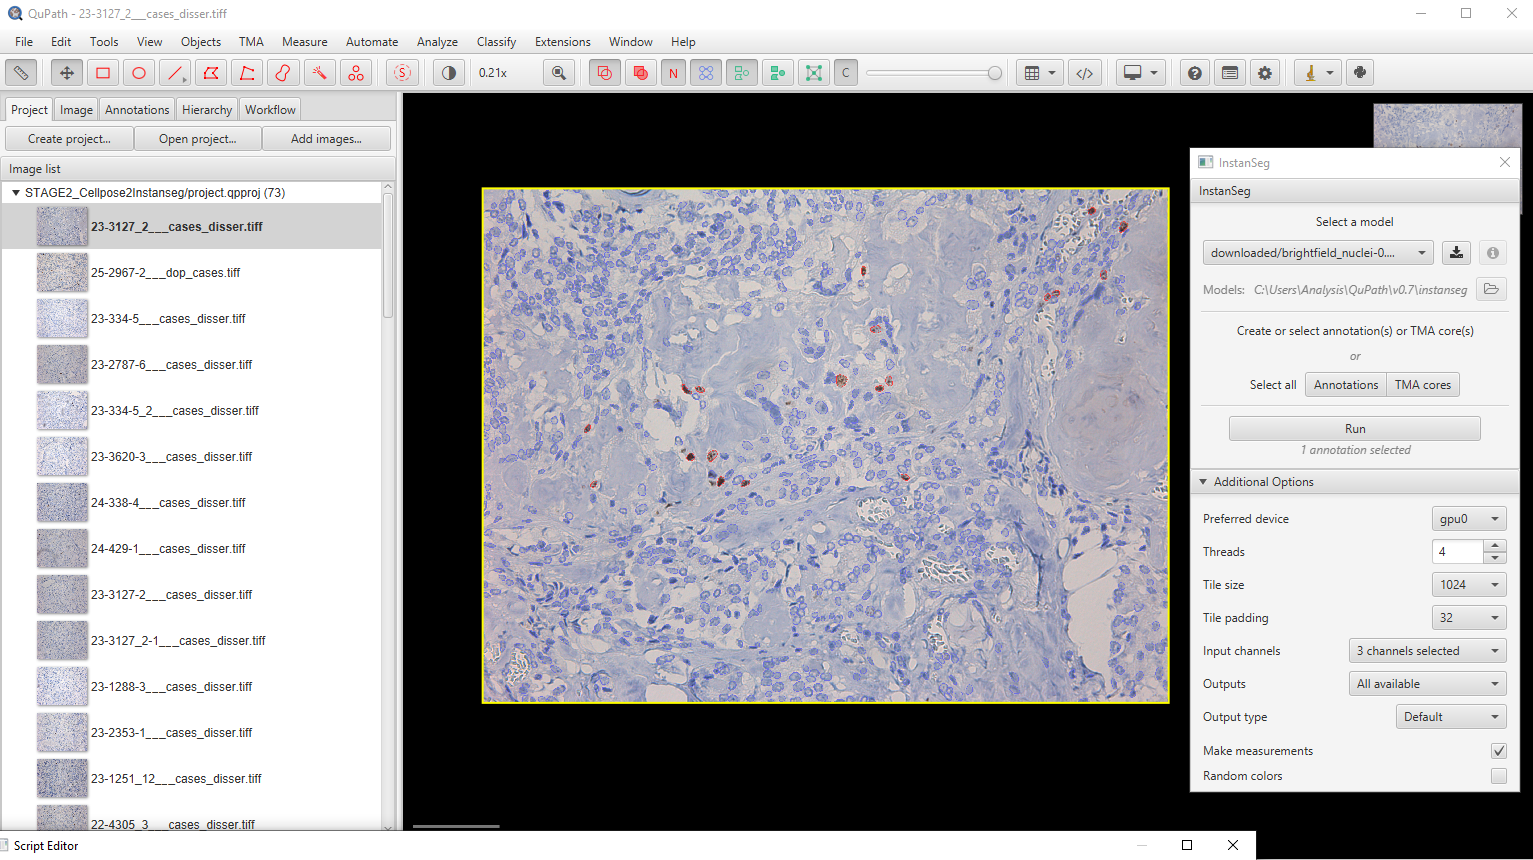
Figure 1. Example of nuclear segmentation, ×200. Ki-67-positive (dark-nuclei) and Ki-67-negative cells are identified separately. For this and subsequent figures (Figs. 2-4): all images were obtained by the authors and have not been published previously.
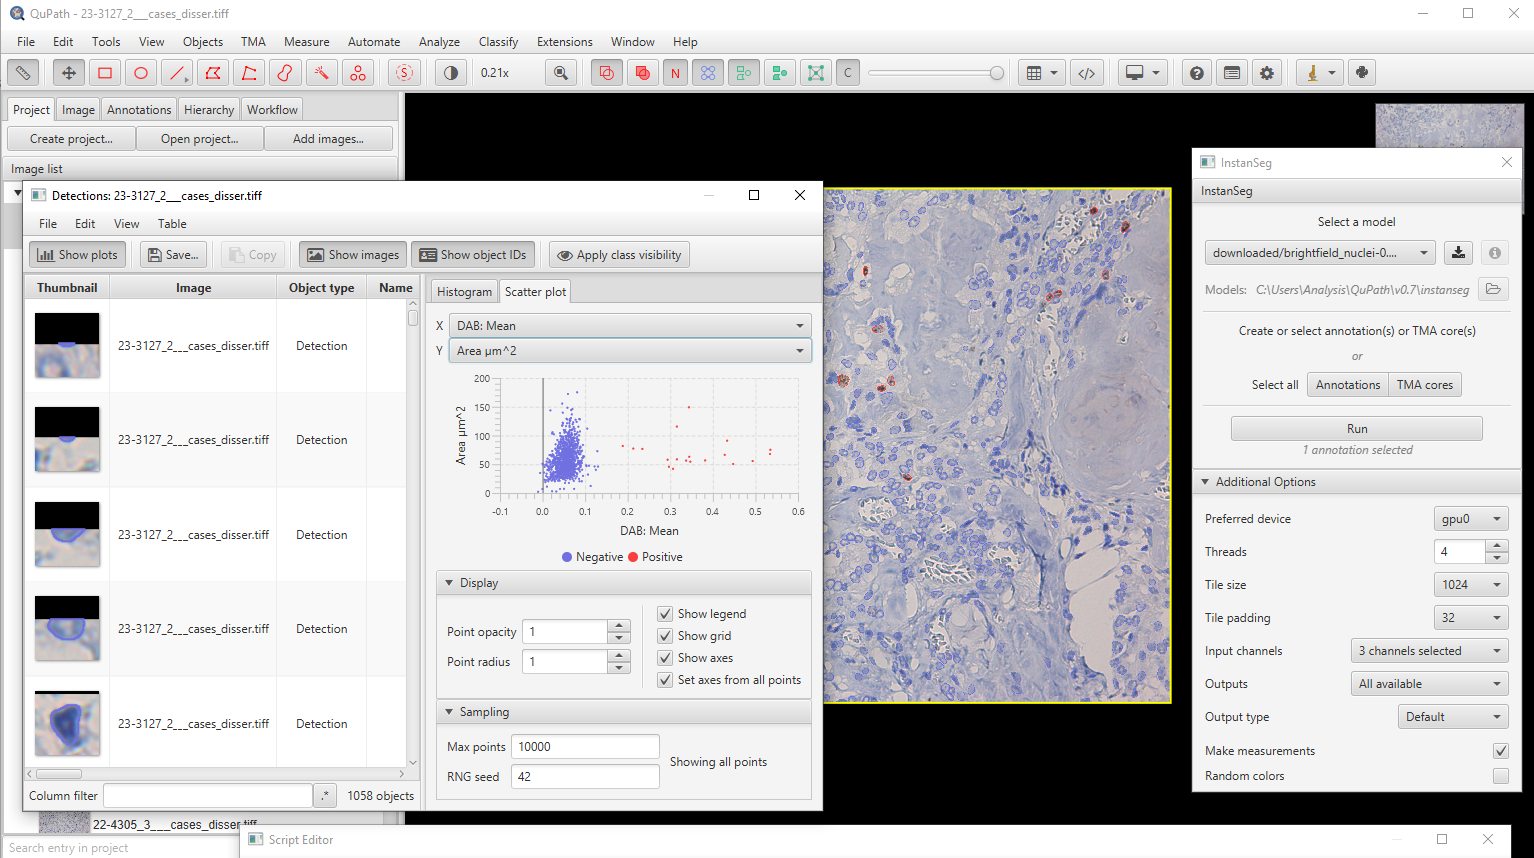
Figure 2. Example of measurement results, ×200.
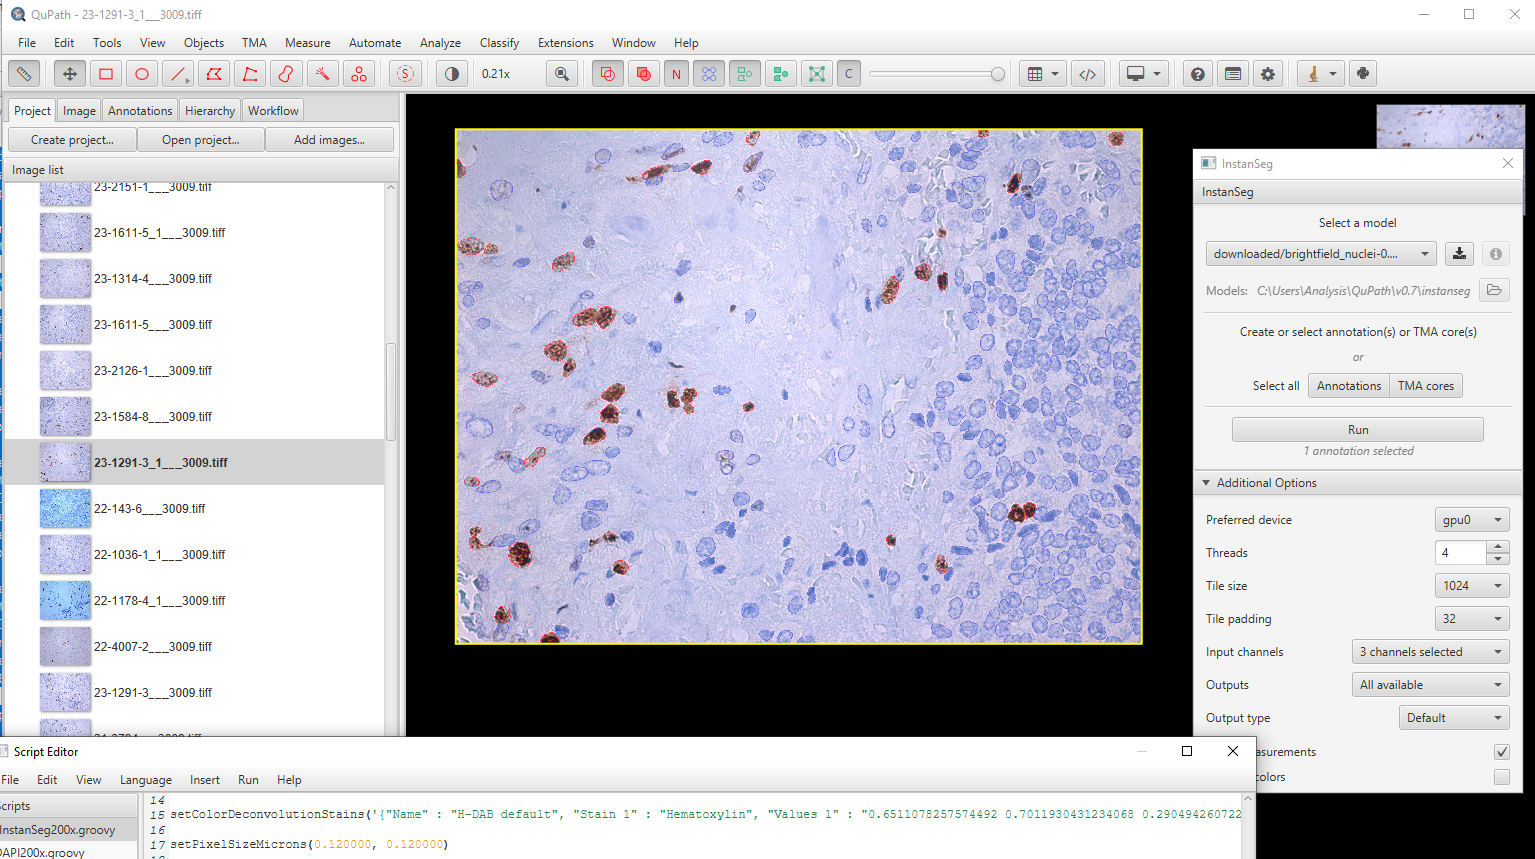
Figure 3. Example of nuclear segmentation, ×400. The model is trained on ×200 specimens; DAB, 3,3′-diaminobenzidine.
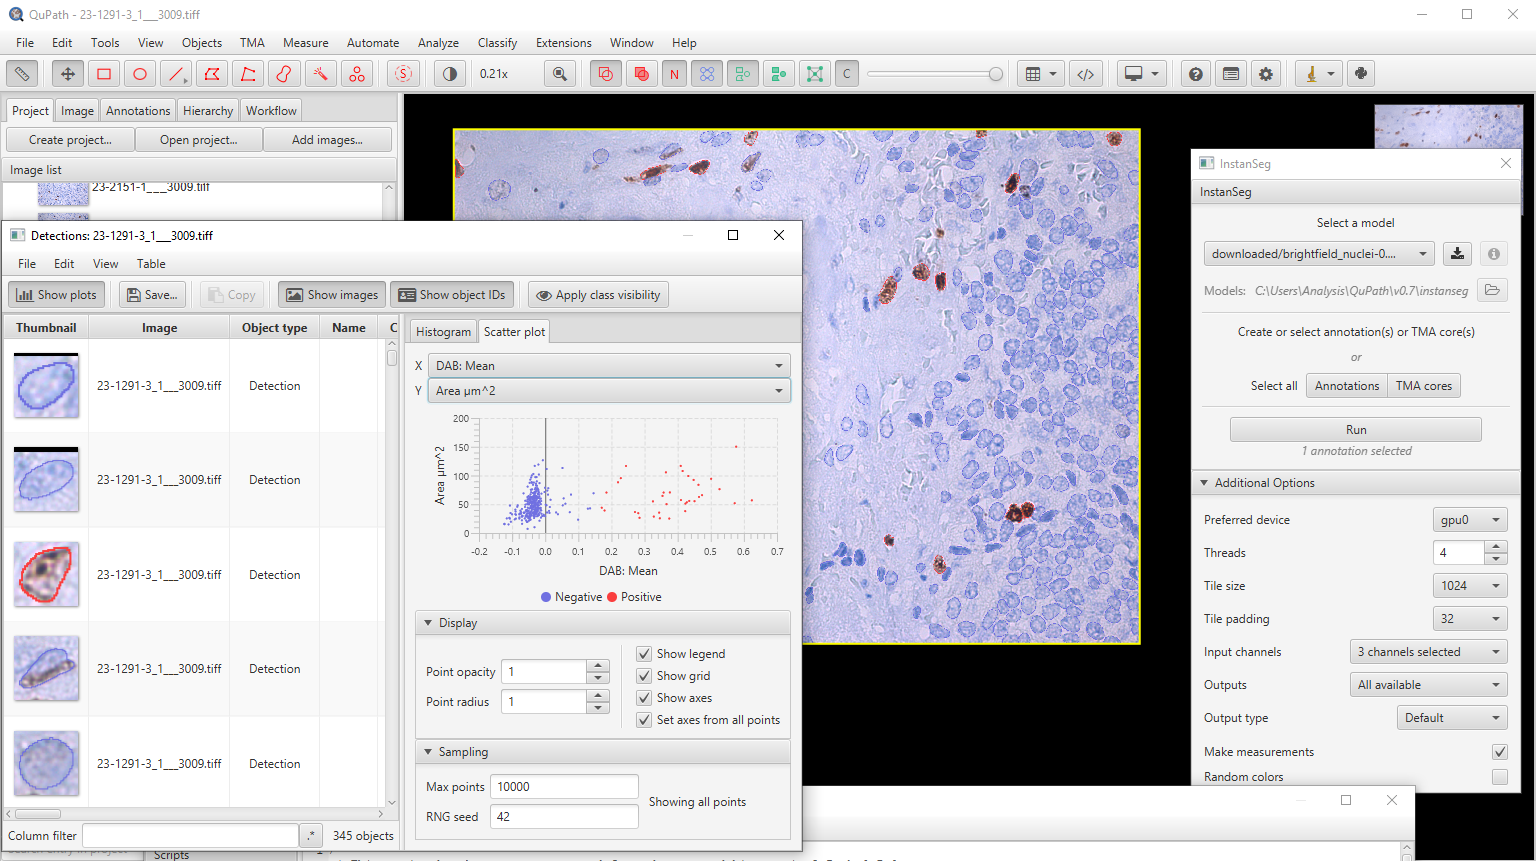
Figure 4. Example of measurement results, ×400.
Table 3. Key parameters of the automated segmentation experiment
| Parameter | Value |
|---|---|
| Dataset size (images) | 73 (×200) |
| Dataset size (512×512-pixel patches) | 2,555 image-mask pairs |
| Architecture | InstanSeg (embedding-based instance segmentation pipeline) |
| Number of training epochs | 350 |
| Best F1-score (test) | 0.774 (epoch 300) |
| Final F1-score (epoch 350) | 0.764 |
| Mean F1 (epochs 300–350) | 0.766±0.004 |
| Training loss reduction | 5.34 → 0.55 (× ~9.8) |
| Test loss reduction | 4.51 → 0.41 (× ~11) |
| Target resolution | ×200 (native), ×400 (downsampling) |
| Postprocessing environment | QuPath + InstanSeg extension |
px, pixel; F1-score, harmonic mean of precision and recall; train loss/test loss, loss function values on the training and test sets, respectively.
Discussion
The results of our study are consistent with a growing body of evidence confirming the prognostic role of proliferative activity in MTC. In a seminal multicenter study by B. Xu et al. on 327 patients, high-grade MTC (defined in part by a Ki-67 index ≥5%) was identified in 24.8% of cases and was independently associated with reduced overall, disease-specific, metastasis-free, and recurrence-free survival [6]. In our study sample, the proportion of patients with Ki-67 ≥5% was 11.8%, which is lower than in the original IMTCGS cohort and many validation studies, where this parameter value ranged 15-48% [7, 8, 19, 20]. This discrepancy likely reflects a prevalence of early-stage disease in our cohort, which was recruited at a specialized center.
The association we observed between a Ki-67 index ≥5%, and vascular and lymphatic invasion is of particular significance. Similar associations were recently described in a Chinese cohort (140 patients) by Z. Zhang et al., where a Ki-67 index ≥5% correlated statistically significantly with larger tumor size, higher T/N stage, a greater extent of lymph node metastasis, and vascular invasion [19]. Comparable findings were reported by E.D. Rossi et al., who demonstrated a correlation between Ki-67 expression and both tumor size and vascular invasion [21]. These results are also consistent with the study by B. Xu et al., in which vascular invasion, along with age and tumor stage, was considered as an independent prognostic factor in multivariate analysis [6]. Thus, the association between increased proliferative activity and an invasive phenotype seems robust and reproducible across geographically distinct cohorts.
However, the findings of related published studies are unequivocal; hence, our data should be interpreted with caution. In the study by E. Vissio et al. on 111 patients, involving an isolated analysis, neither the mitotic index nor Ki-67 correlated with relapse, while only tumor necrosis demonstrated independent prognostic significance. Predictive value was only achieved by combining parameters within the IMTCGS [8]. Similarly, V. Rai et al. noted a discordance between the proportion of tumors with high Ki-67 (60%) and elevated mitotic activity (20%) [20]. These observations emphasize that Ki-67 should not be considered in isolation: optimal stratification is achieved by integrating multiple morphological parameters. This approach is implemented in the prognostic nomogram by Y.A. Aksoy et al., who combined Ki-67, lymphovascular invasion, stage and other features and demonstrated high discriminatory power (area under the curve: 0.94) [22]. The lack of data on mitotic index values and necrosis in our study limits our ability to directly classify observations into IMTCGS categories; consequently, addressing this limitation provides a logical direction for further study.
Digital image analysis and automation of Ki-67 assessment
Inter-observer variability remains a major challenge in Ki-67 assessment for MTC, particularly when proliferation index values fall within the borderline range. Whereas J.F. Williams et al. demonstrated high concordance in Ki-67 assessment within the IMTCGS framework (Cohen’s κ=0.86) [9], the utmost discrepancies predictably arise near the 5% threshold. In a comparison of manual counting with automated platforms, S. Nadeem et al. observed near-perfect correlation (Cohen’s κ=0.88–0.98) but identified discrepancies specifically within the 3–7% Ki-67 range, that is near the critical threshold for grading [10]. This is particularly important given that the median Ki-67 value in our total cohort (1.35%) and the values observed in a subset of patients fall within the range of maximum diagnostic uncertainty.
Our findings align with the limited number of studies on digital assessment of Ki-67 in MTC. Comparing digital analysis using QuPath with manual counting across 85 MTC cases, D.B. Behrman et al. reported very strong correlation (R=0.989), noting greater accuracy in high-grade cases (R=0.99) vs. low-grade ones (R=0.71). The primary challenges included optimizing cell detection, handling overlapping nuclei, and managing tissue artifacts [11], i.e. the same limitations we encountered while developing our analysis pipeline. Evaluating Ki-67 in gastrointestinal neuroendocrine tumors, J.A. Houpt et al. discovered that digital methods (including QuPath) improve accuracy only in some cases, while the primary barriers to implementation remain the time required and the correct selection of ROIs [23]. We achieved the maximum F1-score of 0.774 for the nuclear instance segmentation task aligns with values typical of specialized models trained on limited datasets and is consistent with the efficiency reported for InstanSeg while maintaining comparable accuracy [17].
In this study, we employed a multi-stage automated nuclear segmentation algorithm employing Cellpose-SAM, InstanSeg, and the QuPath software environment. The use of automated analysis minimized the subjectivity of assessment and provided a reproducible count of Ki-67. Integrating the model into QuPath provides batch processing of FFOV images and offers potential for adaptation to routine morphological practice. However, consistent with the conclusions of cited studies, automated counting should be viewed as a tool of supporting, rather than replacing, expert assessment by a pathologist, particularly in the range of borderline Ki-67 values [10, 12].
Clinical significance of the results
Despite the absence of statistically significant differences regarding TNM stage, the Ki-67 ≥5% group exhibited a trend toward a higher incidence of locally advanced cancer and N1b lymph node lesions. The lack of statistical significance is likely attributable to the limited number of patients with high Ki-67 levels. The consistent association of elevated Ki-67 with lymphatic invasion and vascular invasion is of practical importance, since these features are linked to metastatic risk and can contribute to decisions regarding the extent of surgery and the intensity of follow-up. However, a lower level of proliferative activity does not rule out vascular invasion, perineural invasion, or local spread, which highlights the need for a comprehensive morphological assessment rather than reliance on a single marker.
Study limitations
Our study has several limitations. First, it employed a retrospective single-center design, which may have limited the external validity (generalizability) of the results and introduced a selection bias toward early-stage disease. Second, the number of patients with Ki-67 ≥5% was relatively small (n=12), thereby reducing the statistical power of the analysis for specific clinicopathological parameters and potentially leading to an underestimation of certain associations (Type II error). Third, the lack of long-term clinical follow-up, including data on overall and recurrence-free survival, precludes a full assessment of Ki-67 impact on long-term prognosis. Fourth, the mitotic index and tumor necrosis were not measured in this study, making it impossible to fully comply with the IMTCGS classification. Finally, the developed segmentation model was trained on a limited single-center dataset and requires external validation. The achieved F1-score (0.774), while acceptable for a limited dataset, leaves room for improvement.
We used the F1-score (the harmonic mean of precision and recall) as the cumulative metric for segmentation accuracy. However, individual precision and recall trajectories, as well as per-object model confidence scores, were not preserved in the consolidated validation report and therefore cannot be reliably reconstructed retrospectively. This is a technical limitation of the current pipeline and an area for refinement in future pipeline versions. Furthermore, it is important to point out that we compared the results of the automated analysis against the independent assessments by several morphologists within the same institution, whereas mask corrections were performed by just a single morphologist.
Taking into account these limitations, the revealed associations likely underestimate rather than overestimate the true strength of the relationship of Ki-67 with the invasive phenotype.
Directions for further research
A promising avenue for future research is the validation of the developed automated Ki-67 assessment algorithm on larger multi-center cohorts that include FFOV images and a broader range of morphological parameters (including mitotic index and tumor necrosis) in order to fully replicate the IMTCGS criteria. Of particular interest is the integration of digital pathology with the molecular characteristics of MTC, including RET gene status and other genetic alterations, as well as the development of comprehensive prognostic models combining morphological, molecular, and clinical parameters with prospective survival analysis.
Conclusion
Our study demonstrated the clinical and morphological significance of the Ki-67 index in MTC. A Ki-67 level of ≥5% is associated with signs of aggressive tumor behavior, including lymphatic, vascular, and perineural invasion. It is worth noting that the differences regarding lymphatic invasion and vascular invasion remain statistically significant after adjustment for multiple comparisons. The use of automated digital image analysis based on deep learning models provides a reproducible quantitative assessment of Ki-67 expression and minimize the subjectivity of morphological analysis.
We interpret the obtained F1-score (0.774) as a preliminary result. While it confirms the fundamental applicability of the approach, it does not provide sufficient grounds for replacing expert morphological assessment without subsequent external validation. Demonstrated results underscore the promise of using Ki-67 as a component of morphological risk stratification in MTC and highlight the potential of digital pathology to standardize the assessment of tumor proliferative activity. Ultimate validation of the clinical significance of Ki-67 requires further multicenter studies with a long-term follow-up on larger cohorts.
Conflict of interest
The authors declare no actual or potential conflicts of interest related to the conduct of the study or the publication of this article within the last three years.
Author contributions
Bondarenko E.V. – scientific supervision, conducting the study, manuscript editing; Balyasin M.V. – methodology development (digital image analysis), visualization; Pershina-Milyutina A.P. – data curation, statistical analysis; Magomedov Kh.Kh. and Dzampaeva K.Sh. – literature review, preparation of the initial draft manuscript; Kalinin D.V. – study concept, conducting the study. All authors approved the final version of the article prior to publication and agreed to be accountable for all aspects of the study, ensuring that questions related to the accuracy or integrity of any part of the study are appropriately investigated and resolved.
Informed consent for publication
All presented data have been anonymized; no personally identifiable information or patient photographs are included in the article.
Funding
This study was carried out within the framework of the 2026-2028 Government Procurement from the Ministry of Healthcare of the Russian Federation, A Platform for a Fundamentally New Spatial, Comprehensive, Single-Cell Genetic and Transcriptomic Analysis of Diabetes Mellitus, Oncological and Autoimmune Diseases of the Endocrine System, and for the Personalized Treatment (registration number in the Science and Innovation domain: 126082524295-6).
Compliance with ethical principles
The study protocol was approved by the Ethics Committee of the Center for Endocrinology Research (Moscow, Russia) (Protocol No.1; January 15, 2025). Approval and protocol adhered to the principles of the Declaration of Helsinki.
Statement regarding originality
The article is based exclusively on the data collected by the authors. No previously published materials (text, images, data) from third parties were used.
Data availability statement
The data obtained in this study are not publicly available due to confidentiality concerns: the database contains patient information. De-identified data may be provided by the corresponding author upon reasonable request.
Artificial intelligence (AI) use statement
Deep learning models and digital pathology tools described in the Materials and Methods section, specifically Cellpose-SAM, InstanSeg, and the QuPath software environment, were employed in the research phase of the study (quantitative assessment of the Ki-67 index). These technologies served as aids for segmentation and measurement, while the final interpretation of the results was performed by the authors. Generative AI technologies were not used to draft the manuscript or prepare illustrations.
Article origin and peer review
The article was submitted at the authors’ initiative and is published following external peer review.
Medullary Thyroid Cancer: Clinical guidelines. Association of Oncologists of Russia, Russian Association of Endocrinologists. Moscow, 2024. (In Russ.).
Hernandez-Prera JC, Riddle N, Gonzalez RS, Asa SL. Endocrine and neuroendocrine tumors: Updates from the 5th edition of the World Health Organization “Blue Book”. Arch Pathol Lab Med 2025; 149(12): 1114-1135. https://doi.org/10.5858/arpa.2024-0315-ra.
Fugazzola L. Medullary thyroid cancer – An update. Best Pract Res Clin Endocrinol Metab. 2023; 37(1): 101655. https://doi.org/10.1016/j.beem.2022.101655.
Wells SA Jr, Asa SL, Dralle H, et al. Revised American Thyroid Association guidelines for the management of medullary thyroid carcinoma. Thyroid 2015; 25(6): 567-610. https://doi.org/10.1089/thy.2014.0335.
Scholzen T, Gerdes J. The Ki-67 protein: From the known and the unknown. J Cell Physiol 2000; 182(3): 311-322. https://doi.org/10.1002/(SICI)1097-4652(200003)182:3<311::AID-JCP1>3.0.CO;2-9.
Xu B, Fuchs TL, Ahmadi S, et al. International Medullary Thyroid Carcinoma Grading System: A validated grading system for medullary thyroid carcinoma. J Clin Oncol 2022; 40(1): 96-104. https://doi.org/10.1200/JCO.21.01329.
Lubin DJ, Behrman DB, Goyal S, et al. Independent validation of the international grading system for medullary thyroid carcinoma: A single institution experience. Mod Pathol 2023; 36(9): 100235. https://doi.org/10.1016/j.modpat.2023.100235.
Vissio E, Maletta F, Fissore J, et al. External validation of three available grading systems for medullary thyroid carcinoma in a single institution cohort. Endocr Pathol 2022; 33(3): 359-370. https://doi.org/10.1007/s12022-022-09719-z.
Williams JF, Zhao M, Najdawi F, et al. Grading of medullary thyroid carcinoma: An interobserver reproducibility study. Endocr Pathol 2022; 33(3): 371-377. https://doi.org/10.1007/s12022-022-09718-0.
Nadeem S, Hanna MG, Viswanathan K, et al. Ki67 proliferation index in medullary thyroid carcinoma: A comparative study of multiple counting methods and validation of image analysis and deep learning platforms. Histopathology 2023; 83(6): 981-988. https://doi.org/10.1111/his.15048.
Behrman DB, Lubin DJ, Magliocca K, et al. Exploration of digital image analysis for Ki67 quantification in the grading of medullary thyroid carcinoma: A pilot study with 85 cases. Head Neck Pathol 2023; 17(3): 638-646. https://doi.org/10.1007/s12105-023-01564-8.
Dy A, Nguyen NJ, Meyer J, et al. AI improves accuracy, agreement and efficiency of pathologists for Ki67 assessments in breast cancer. Sci Rep 2024; 14(1): 1283. https://doi.org/10.1038/s41598-024-51723-2.
Acs B, Pelekanou V, Bai Y, et al. Ki67 reproducibility using digital image analysis: An inter-platform and inter-operator study. Lab Invest 2019; 99(1): 107-117. https://doi.org/10.1038/s41374-018-0123-7.
Pai R, Karki S, Agarwal R, et al. Optimal settings and clinical validation for automated Ki67 calculation in neuroendocrine tumors with open source informatics (QuPath). J Pathol Inform 2022; 13: 100141. https://doi.org/10.1016/j.jpi.2022.100141.
Luchini C, Pantanowitz L, Adsay V, et al. Ki-67 assessment of pancreatic neuroendocrine neoplasms: Systematic review and meta-analysis of manual vs. digital pathology scoring. Mod Pathol 2022; 35(6): 712-720. https://doi.org/10.1038/s41379-022-01055-1.
Stringer C, Wang T, Michaelos M, Pachitariu M. Cellpose: A generalist algorithm for cellular segmentation. Nat Methods 2021; 18(1): 100-106. https://doi.org/10.1038/s41592-020-01018-x.
Goldsborough T, Philps B, O’Callaghan A, et al. InstanSeg: An embedding-based instance segmentation algorithm optimized for accurate, efficient and portable cell segmentation. arXiv [preprint] 2024; 2408: 15954. https://doi.org/10.48550/arXiv.2408.15954.
Bankhead P, Loughrey MB, Fernández JA, et al. QuPath: Open source software for digital pathology image analysis. Sci Rep 2017; 7(1): 16878. https://doi.org/10.1038/s41598-017-17204-5.
Zhang Z, Yang Y, Dou Y, et al. Clinical pathological characteristics and prognostic analysis of 140 cases of medullary thyroid carcinoma: Validation of the international medullary thyroid carcinoma grading system in a Chinese cohort. Diagn Pathol 2026; 21(1): 50. https://doi.org/10.1186/s13000-026-01787-7.
Rai V, Saha A, Mehta S, et al. International medullary thyroid carcinoma grading system: An Indian tertiary care centre experience. Eur Arch Otorhinolaryngol 2024; 281(3): 1571-1579. https://doi.org/10.1007/s00405-023-08341-x.
Rossi ED, Raia S, Maratta M, et al. Immunohistochemical expression of Ki-67, INSM1, and SSTR2A in medullary thyroid carcinoma: Correlation with tumour size, vascular invasion, and biochemical outcome. Virchows Arch. 2026; 489(2): 427-439. https://doi.org/10.1007/s00428-025-04018-4.
Aksoy YA, Xu B, Viswanathan K, et al. Novel prognostic nomogram for predicting recurrence-free survival in medullary thyroid carcinoma. Histopathology 2024; 84(6): 947-959. https://doi.org/10.1111/his.15141.
Houpt JA, Liu E, Wang H, et al. Determination of Ki-67 indices in neuroendocrine tumours of the gastrointestinal tract: The past, the present, and the future. Virchows Arch 2025; 486(5): 1001-1009. https://doi.org/10.1007/s00428-024-03963-w.